¶ Debugger
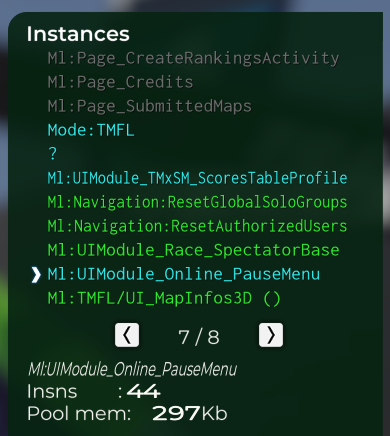
You can launch the debugger with twice CTRL+G in-game.

- Grey script means that the script isn't executed right now.
- Green means that the script is executed and
running - Red means the script is executed and
not running - Cyan means that this script is executed and consume a lot of memory.
The Insns value is the instructions per frame number executed by the script. The pool mem is the size of all variables stored inside this script. Sometimes you can see the number of layers or number of audio sources created by this script.
For a better debugging, the name inside the Instances list must be clear. You can modify it on the manialink tag, example :
<manialink name="TMFL/UI_MapInfos3D" version="3">
	....
</manialink>
¶ Tuning method
There is a tool to check what slow down the most inside your script (work on server game mode and client UI side).
Note for plugin developers: this will not work for ML injected directly to a CGameUILayer. It will only work if you can read the contents of the script in the script viewer.
How to do it :
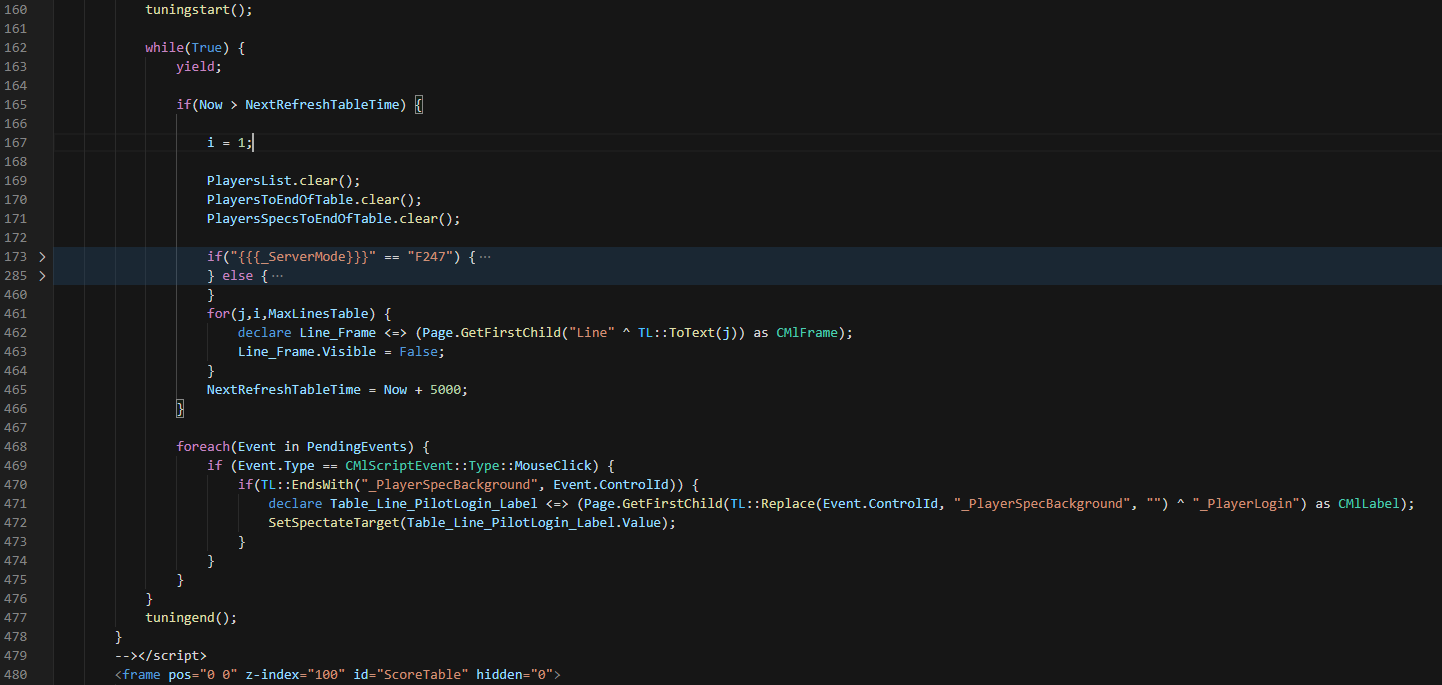
- Add
tuningstart();andtuningend();to your code. - Start your script.
- Let the script run for some time (at least 15s) to gather a fair amount of data. If your tuning only occur on some event, or once in a while, be sure to meet the conditions multiple times (the more the better).
- Open the "Script Debugger" (with Ctrl + G twice).
- Select the script you are tuning in the "Instances" list.
- The full tuning log has the been copied to your clipboard ! (<= yep, that's the ugly part)
- You can then paste it in your preferred text editor to see the results.
¶ Troubleshooting
- Is the script contents viewable in the script viewer? (It must be)
- Are you injecting the ML via AngelScript? (No known way to do this, currently)
- Are
tuningstart();andtuningend();in themainfunction? (This might be required)
¶ Example result :

>>>>>>>>>>>>>>>>>>>>>>>>>
Ml:TMFL/UI_ScoreTable ()
>>>>>>>>>>>>>>>>>>>>>>>>>
Average time spent per frame in units of 10ns
[ Line]	    line	function	     %age
[00019]	    0.00	    0.00	    0.00%		        Text LeftPad(Integer number, Integer pad) {
[00020]	    0.00	    0.00	    6.10%		            declare Text out = "";
[00021]	    0.00	    0.00	   31.86%		            out = "" ^ number;
[00022]	    0.00	    0.00	    0.00%		            if (number < 100 && pad == 3) {
[00023]	    0.00	    0.00	    0.00%		                out = "0" ^ number;
[00024]	    0.00	    0.00	   18.31%		            }
[00025]	    0.00	    0.00	    0.00%		            if (number < 10 && pad == 3) {
[00026]	    0.00	    0.00	    0.00%		                out = "00" ^ number;
[00027]	    0.00	    0.00	    7.80%		            }
[00028]	    0.00	    0.00	    0.00%		            if (number < 10 && pad == 2) {
[00029]	    0.00	    0.00	   23.39%		                out = "0" ^ number;
[00030]	    0.00	    0.00	   12.54%		            }
[00031]	    0.00	    0.00	    0.00%		            return out;
[00032] 0.00 0.00 0.00% }The %age is the percentage of load of the function or the line, depends if you are inside the main or inside a function. Here we can see that it's the line n°21 that's consuming the more ressource from this function.
The number under line and function column is the time spend on each line.
To check the most consuming part of your script, find the highest number on line column line and %age.
The “line” column should not have a number > 0.25. Or for writing network variables but only case. Increasing this number can create lags on server side or client side, depending where you're tuning.
¶ tuningmark()
Via Eole on the Openplanet discord, referring to the Ctrl+F7 profiler:
You can use
tuningmark()functions to add blocks in the graph.Void SomeFunction() { tuningmark("SomeFunction"); // ... do things tuningmark("SomeFunction_End"); }This will add a block named
SomeFunctionmeasuring the time spent betweentuningmark("SomeFunction");andtuningmark("SomeFunction_End");. Each call totuningmark()create a new block measuring the time spent until the nexttuningmark(),yieldor context.
¶ Further Reading
¶ Profiler
The profiler is the most advanced tool for debugging lags / cycles times and frame performance. It can be very useful when having some big game mode and you need to adjust all the calculations to limit the client lag.
The tool can be accessible with CTRL+F7 in game.
Via Beu on the Openplanet discord:
Each yellow column is the time spent to generate a frame. The bottom ones are from the CPU, the top ones are from the GPU.
right click to pause the profiler, then left click on a yellow line to select a frame
then, you can zoom in it using Shift + Middle Mouse Click + Move your mouse on the right
and you can move in it using Middle Mouse Click + moving your mouse
the line namedUpdate_AfterMainLoopwill contain the scripts updates, and if you zoom enough on it, you will have the name of the script that took time to update